
Page 14 - 22825_Fulltext
P. 14
ฏ
of the distribution are estimated to determine the criteria for the score level of the indexes. The
estimation method in this study includes Singh-Maddala Distribution for maintaining the properties
of the random variables. The results will be applied to create the composite index of all four
indicators.
The resources are both statistical data from relevant agencies with continuously collected
data and data from opinion polls across the country by the National Statistical Office. The majority
of the data suggests physical violence, acceptance of diversity, non-discrimination, and respect for
human rights. The data on safety/security in society and social equality/fair distribution of resources
are mainly from the agencies. The majority of the information is presented as indicators at both
the national and provincial levels.Some of them are not collected properly, so they will be
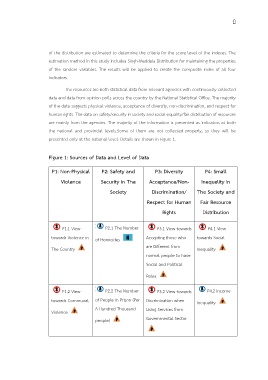
presented only at the national level. Details are shown in Figure 1.
Figure 1: Sources of Data and Level of Data
P1: Non-Physical P2: Safety and P3: Diversity P4: Small
Violence Security in The Acceptance/Non- Inequality in
Society Discrimination/ The Society and
Respect for Human Fair Resource
Rights Distribution
P1.1 View P2.1 The Number P3.1 View towards P4.1 View
towards Violence in of Homicides Accepting those who towards Social
are Different from
The Country Inequality
normal people to have
Social and Political
Roles
P1.2 View P2.2 The Number P3.2 View towards P4.2 Income
towards Communal of People in Prison (Per Discrimination when Inequality
A Hundred Thousand Using Services from
Violence
people) Governmental Sector