
Page 138 - kpi20440
P. 138
KPI Congress 20th
138
2018
Thai Democracy on the Move
(Fiscal Year) 2000, it was only 3.3% of GDP or IDR 32.9 trillion. When compared to domestic
revenue, the percentage of realized funds raised in FY 2000 was only around 16% of the
domestic revenues, while for FY 2001 it increased to 27% (APBN-P 2001) (Sidik 2002).
Meanwhile, when compared with state expenditures, the realization of funds raised
in FY 2000 was 14.9% of the total state expenditures, while in the 2001 FY it was around
23.2% of the state expenditures. Meanwhile, the development of funds submitted through
the balancing fund in the 2002 FY (APBN 2002) experienced a significant increase, reaching Rp.
94.53 trillion or 5.6% of GDP or an increase of 5.1% compared to the fiscal fund of FY 2001.
When compared with the domestic revenue for FY 2002, the balancing fund reached 31.3%
while when compared to the FY 2002 state expenditure reached 27.5%. In 2017, the amount
of balance funds given to the regions reached Rp. 704.9 trillion. The funds are outside the
transfer funds allocated by the Central Government as village funds.
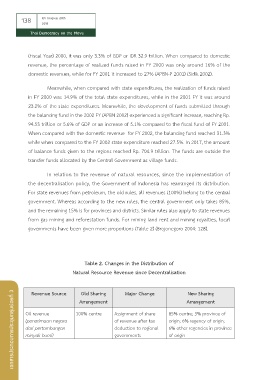
In relation to the revenue of natural resources, since the implementation of
the decentralisation policy, the Government of Indonesia has rearranged its distribution.
For state revenues from petroleum, the old rules, all revenues (100%) belong to the central
government. Whereas according to the new rules, the central government only takes 85%,
and the remaining 15% is for provinces and districts. Similar rules also apply to state revenues
from gas mining and reforestation funds. For mining land rent and mining royalties, local
governments have been given more proportions (Table 2) (Brojonegoro 2004: 128).
Table 2. Changes in the Distribution of
Natural Resource Revenue since Decentralisation New Sharing
Major Change
Revenue Source
Old Sharing
เอกสารประกอบการประชุมกลุ่มย่อยที่ 3 Oil revenue 100% centre Assignment of share 85% centre; 3% province of
Arrangement
Arrangement
origin; 6% regency of origin;
of revenue after tax
(penerimaan negara
6% other regencies in province
dari pertambangan
deduction to regional
minyak bumi)
of origin
governments