
Page 148 - kpi21190
P. 148
148
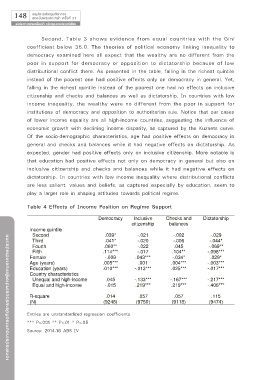
Second, Table 3 shows evidence from equal countries with the Gini
coefficient below 35.0. The theories of political economy linking inequality to
democracy examined here all expect that the wealthy are no different from the
poor in support for democracy or opposition to dictatorship because of low
distributional conflict there. As presented in the table, falling in the richest quintile
instead of the poorest one had positive effects only on democracy in general. Yet,
falling in the richest quintile instead of the poorest one had no effects on inclusive
citizenship and checks and balances as well as dictatorship. In countries with low
income inequality, the wealthy were no different from the poor in support for
institutions of democracy and opposition to authoritarian rule. Notice that our cases
of lower income equality are all high-income countries, suggesting the influence of
economic growth with declining income disparity, as captured by the Kuznets curve.
Of the socio-demographic characteristics, age had positive effects on democracy in
general and checks and balances while it had negative effects on dictatorship. As
expected, gender had positive effects only on inclusive citizenship. More notable is
that education had positive effects not only on democracy in general but also on
inclusive citizenship and checks and balances while it had negative effects on
dictatorship. In countries with low income inequality where distributional conflicts
are less salient, values and beliefs, as captured especially by education, seem to
play a larger role in shaping attitudes towards political regime.
Table 4 Effects of Income Position on Regime Support
Tab le Effects of Income P osition on R egime Sup p ort
D emocracy I n clusiv e C heck s an d D ictatorship
citiz en ship b alan ces
I n come q uin tile
Secon d .03 9* -.021 -.002 -.029
เอกสารประกอบการอภิปรายร่วมระหว่างผู้แทนจากต่างประเทศ
T hird .041* -.020 -.006 -.044*
F ourth .060* * -.022 .045 -.069* *
F ifth .114* * * -.017 .104* * -.096* * *
F emale -.009 .043 * * * -.03 4* .029*
A g e (y ears) .005* * * .001 .004* * * -.003 * * *
E ducation (y ears) .010* * * -.013 * * * .025* * * -.017 * * *
C oun try characteristics
U n eq ual an d hig h-in come .045 -.13 3 * * * -.167 * * * -.217 * * *
E q ual an d hig h-in come -.015 .219* * * .219* * * -.406* * *
R -sq uare .014 .057 .057 .115
(N) (9248 ) (97 50) (9118 ) (947 4)
E n tries are un stan dardiz ed reg ression coefficien ts.
* * * P < .001 * * P < .01 * P < .05
Entries are unstandardized regression coefficients.
Source: 2014-16 A B S I V
*** P<.001 ** P<.01 * P<.05
Source: 2014-16 ABS IV
18