
Page 143 - kpi21190
P. 143
143
) 4
orruption k tile ran 5 3 .50 .46 .02
trol of C ercen 91.3 66.8 6.92 7 9.42 3 7 3 9.90 3 63 96.63 7 3 dicators.
n
on (P
ce I
C
an
) 4 ern
aw k tile ran 5 ov
ule of L 9.42 8 0.29 8 4.62 8 9.42 3 3 41.8 .27 43 .7 68 94.23 50.96 orldwide G
R ercen
(P
d 4 W
t, le an
i coefficien come) 3 0.2 9.9 .8
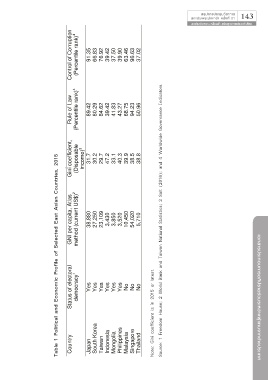
Table 1 Political and Economic Profile of Selected East Asian Countries, 2015
.2 .1 .5
15 isposab 1.7 29.7 40.3
0 3 3 47 3 3 3 8 3 8 3 Solt (2016);
2 in
in (D
G
3
tlas ) 2 S$ t U al Statistics; 15
per capita, A rofile of Selected East Asian Countries, 0 8 ,8 8 3 ,250 27 ,109 23 0 ,43 3 50 ,8 3 ,520 3 10,450 54,020 10 5,7 Nation Source: 1 Freedom House; 2 World Bank and Taiwan National Statistics; 3 Solt (2016); and 4 Worldwide Governance Indicators.
NI method (curren aiwan
G d T
an 2015 or latest. k an orld B
1
olitical and Economic P Status of electoral democracy es Y es Y es Y es Y es Y es Y No No No t is in i coefficien Note: Gini coefficient is in 2015 or latest. 2 W ouse; reedom H เอกสารประกอบการอภิปรายร่วมระหว่างผู้แทนจากต่างประเทศ
le 1 P try orea esia olia g es hilippin sia apore d in Source: 1 F
Tab oun apan South K aiwan don on alay g Sin hailan Note: G
C J T n I M P M T