
Page 70 - kpi16531
P. 70
นวัตกรรมการพัฒนารายได้ 3
ขององค์กรปกครองส่วนท้องถิ่น
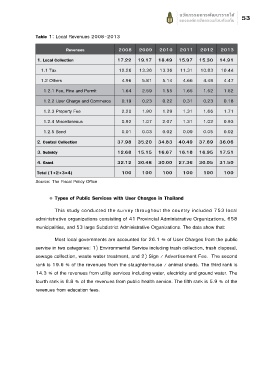
Table 1: Local Revenues 2008-2013
Revenues 2008 2009 2010 2011 2012 2013
1. Local Collection 17.22 19.17 18.49 15.97 15.30 14.91
1.1 Tax 12.26 13.36 13.36 11.31 10.83 10.44
1.2 Others 4.96 5.81 5.14 4.66 4.48 4.47
1.2.1 Fee, Fine and Permit 1.64 2.59 1.55 1.65 1.52 1.62
1.2.2 User Charge and Commerce 0.19 0.23 0.22 0.31 0.23 0.18
1.2.3 Property Fee 2.20 1.90 1.29 1.31 1.66 1.71
1.2.4 Miscellaneous 0.92 1.07 2.07 1.31 1.02 0.93
1.2.5 Bond 0.01 0.03 0.02 0.09 0.05 0.02
2. Central Collection 37.98 35.20 34.83 40.49 37.69 36.06
3. Subsidy 12.68 15.15 16.67 16.18 16.95 17.51
4. Grant 32.12 30.48 30.00 27.36 30.05 31.50
Total (1+2+3+4) 100 100 100 100 100 100
Source: The Fiscal Policy Office
= Types of Public Services with User Charges in Thailand
This study conducted the survey throughout the country included 753 local
administrative organizations consisting of 41 Provincial Administrative Organizations, 658
municipalities, and 53 large Subdistrict Administrative Organizations. The data show that:
Most local governments are accounted for 26.1 % of User Charges from the public
service in two categories: 1) Environmental Service including trash collection, trash disposal,
sewage collection, waste water treatment, and 2) Sign / Advertisement Fee. The second
rank is 19.6 % of the revenues from the slaughterhouse / animal sheds. The third rank is
14.3 % of the revenues from utility services including water, electricity and ground water. The
fourth rank is 8.8 % of the revenues from public health service. The fifth rank is 5.9 % of the
revenues from education fees.